
Pick a date range and bucket
Reports is built around date ranges. Use the preset chips (week, month, year-to-date) or set a custom range. Adjust the bucket (day / week / month) to control chart granularity.
Filter by technician
As an admin, the technician multi-select chips let you focus on a single person, a subset of the team, or — by leaving the chips empty — the entire company. Per-performer breakdowns appear when you have multiple techs selected.
Mileage
The mileage chart shows distance driven over the selected range, bucketed however you set it. Useful for fleet planning and reimbursement.
Chemical dosages
Tick the chemicals you care about and the dosages chart shows how much of each you used over time. Combined with the technician filter, this is how you spot a tech who's consistently over- or under-dosing.
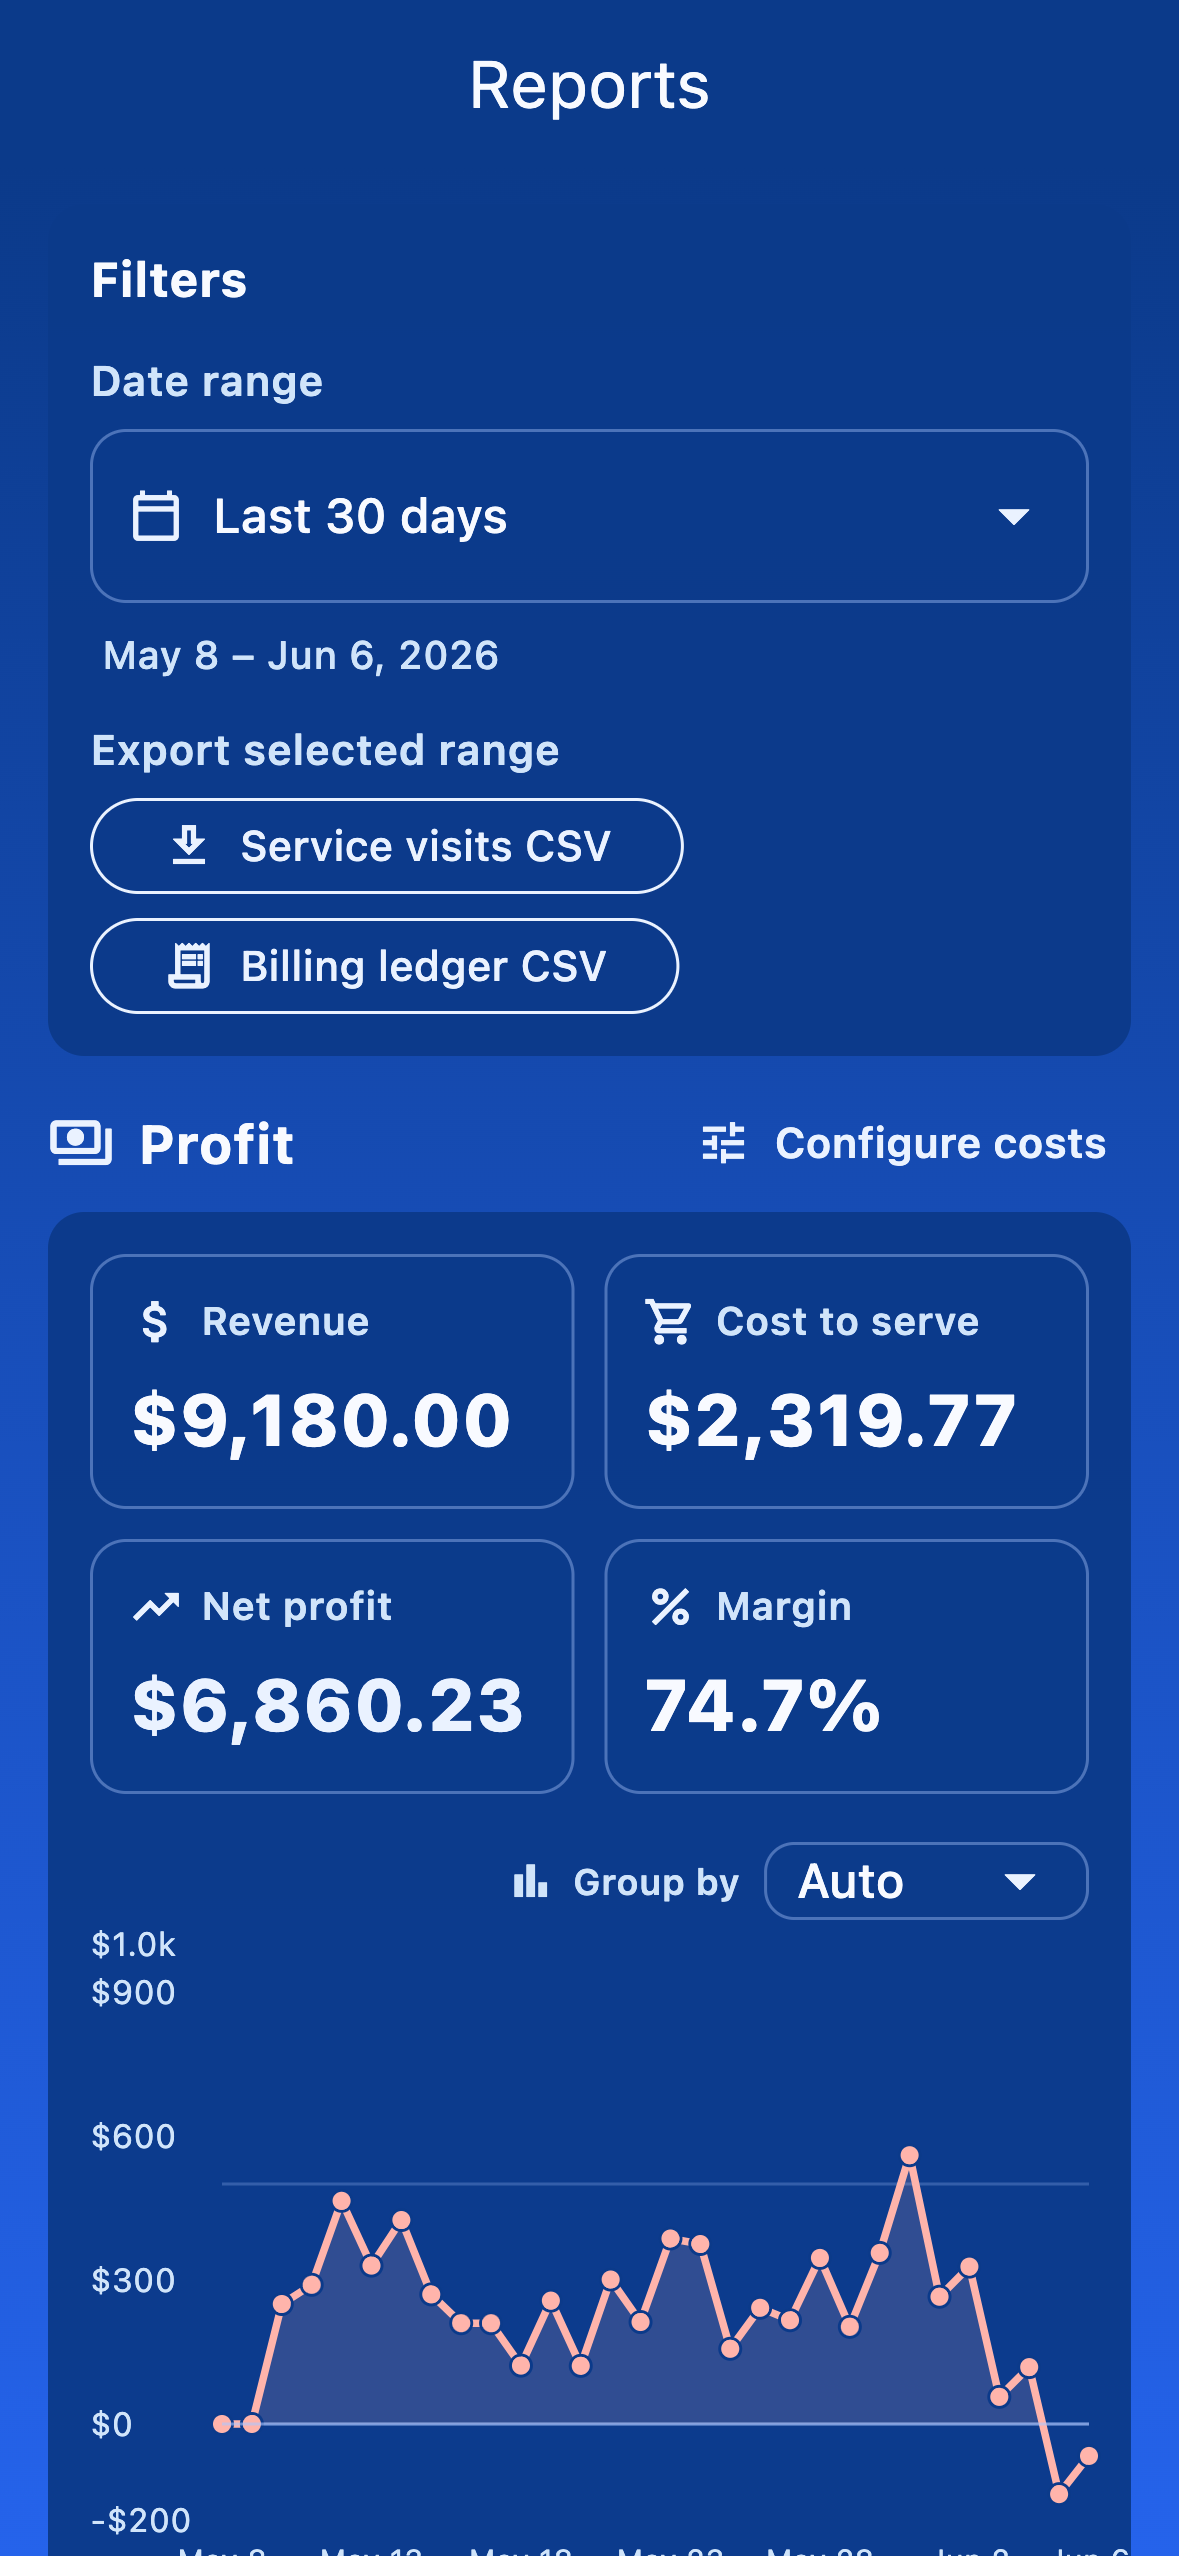
Profitability
The profitability report answers the question most owners care about: are you charging enough for each stop? It estimates profit per customer and per pool by weighing what you bill against what the work costs you — drive time and distance to the pool, time spent on service, and the cost of the chemicals used.
First open Configure costs and set your inputs once: an hourly labor rate, a mileage rate (it defaults to the current IRS standard mileage rate, which you can override), and per-chemical costs. The report then ranks customers and pools so you can spot the stops that barely break even — the ones to reprice, route more efficiently, or drop.